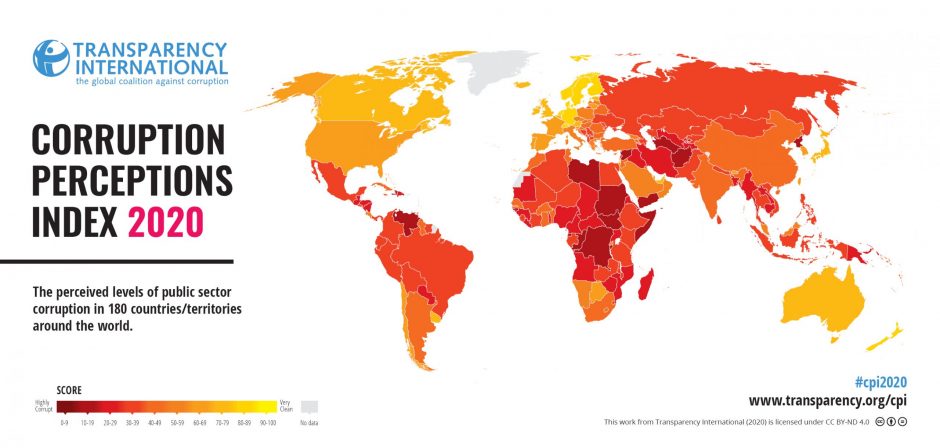
The Corruption Perception Index (CPI) ranks countries and territories based on how corrupt their public sectors are perceived to be. The score of a country or territory reflects the perceived level of corruption in the public sector on a scale of 0 to 100, where a 0 indicates that a country is perceived as highly corrupt whereas a 100 means that it is perceived as very transparent. A country’s rank indicates its position relative to the other countries and territories ranked in the index. 177 countries and territories were included in the index in 2013. It is a composite index – a combination of surveys and assessments of corruption, collected by a variety of respectable institutions.
Eight sources were used to determine the CPI of Lithuania in 2013: 1. Bertelsmann Foundation Transformation Index 2014; 2. Bertelsmann Foundation Sustainable Governance Indicators 2014; 3. IMD World Competitiveness Yearbook 2013; 4. Political Risk Services International Country Risk Guide (ICRG); 5. World Economic Forum Executive Opinion Survey (EOS) 2013; 6. Economist Intelligence Unit. Country Risk Ratings; 7. Global Insight Country Risk Ratings; 8. Freedom House Nations in Transit 2013.
The TI CPI is one of the most well-known corruption perception indicators in the world, showing how various states fare in dealing with corruption.


